top of page
About
How might I build a comprehensive 2024-2025 regular season data tracker?
By recreating the NBA schedule and using Excel functions, I will be able to generate a massive amount of data.

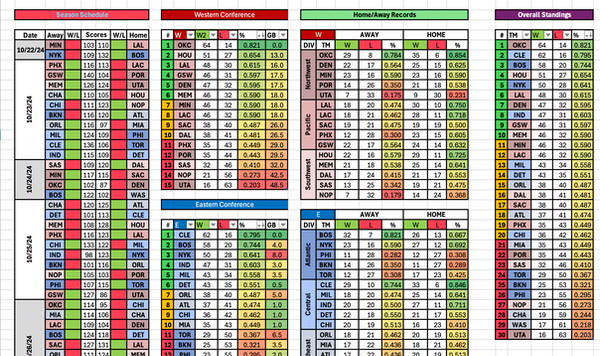
Season Schedule
Use IF functions and conditional formatting to collect both W/L data and make W/L's more quickly identifiable
Allows you to calculate the entire rest of the sheet's data
Each team is formatted with a 3-letter code and a division color (that also accounts for conference color). This helps to visually organize teams and simplify long team names, making data entry simpler
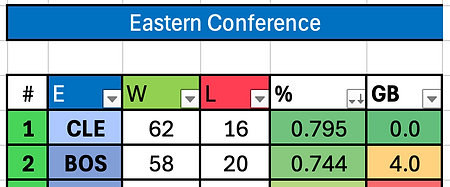
Eastern and Western Conference
Use COUNTIFs functions to calculate Ws and Ls, which then allows you to calculate % (Win %) and GB (games behind)
Putting all this data into a table allows you to filter by %, which orders teams in their correct seeds, making it accurate for playoff matchups
Conditional formatting color cells based on descending order (green = highest value, yellow = middle value, red = lowest value)

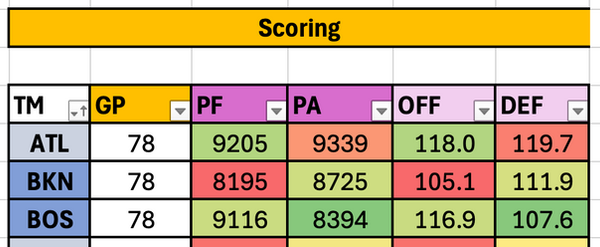
Scoring
Used XLOOKUPs and SUMIFs to pull data from other tables to populate in the Scoring table
By using AVERAGEs to calculate PF/GP and PA/GP, I was able to calculate an OFF and DEF score, a good estimate for a team's performance on offense and defense
Conditional formatting colors cells based on descending order (green = highest value, yellow = middle value, red = lowest value). Flipped to ascending order colors for PA and DEF
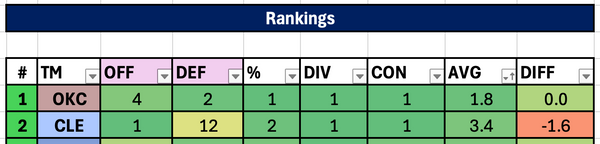
Rankings
Used XLOOKUPs to pull data from other tables to populate in the Rankings table
By normalizing the data as rankings, I was able to calculate an AVG (average score) that can be used as a filter to rank teams more accurately, based on: OFF, DEF, %, DIV (division rank), CON (conference rank), and DIFF
These rankings DO NOT match conference rankings, but instead, directly compare each team to each other
Conditional formatting colors cells based on ascending order (green = lowest value, yellow = middle value, red = highest value). Flipped to descending order for DEF
Playoffs

Used XLOOKUPs to pull data from other tables to populate in the Playoffs grid system
Data being pulled in is showing the record of each team. Once a team reaches 4 Ws, they will be automatically seeded into the next round. The records are color coded using conditional formatting (0 = red, 4 = green)
The play-in winners will be automatically filled into their respective TBD slots using IF functions and all other TBDs will fill in based on series winners
bottom of page